My FDCServers VPS Stayed Online While Disk Reads Took 18.7 Seconds
I actually liked FDCServers.
For quite a while, my VPS worked exactly the way I wanted it to.
It handled real production traffic. Nginx behaved normally. The backend behaved normally. I was not watching the server every five minutes or looking for reasons to blame the hosting provider.
Then requests started slowing down.
Some eventually timed out completely.
The strange part was that the VPS did not look dead.
It was online.
Nginx was running.
The application was running.
Ping worked.
Sometimes I could SSH into the machine, check a few basic metrics, and see nothing dramatic.
Then I managed to catch the server during one of the actual failures.
That changed everything.
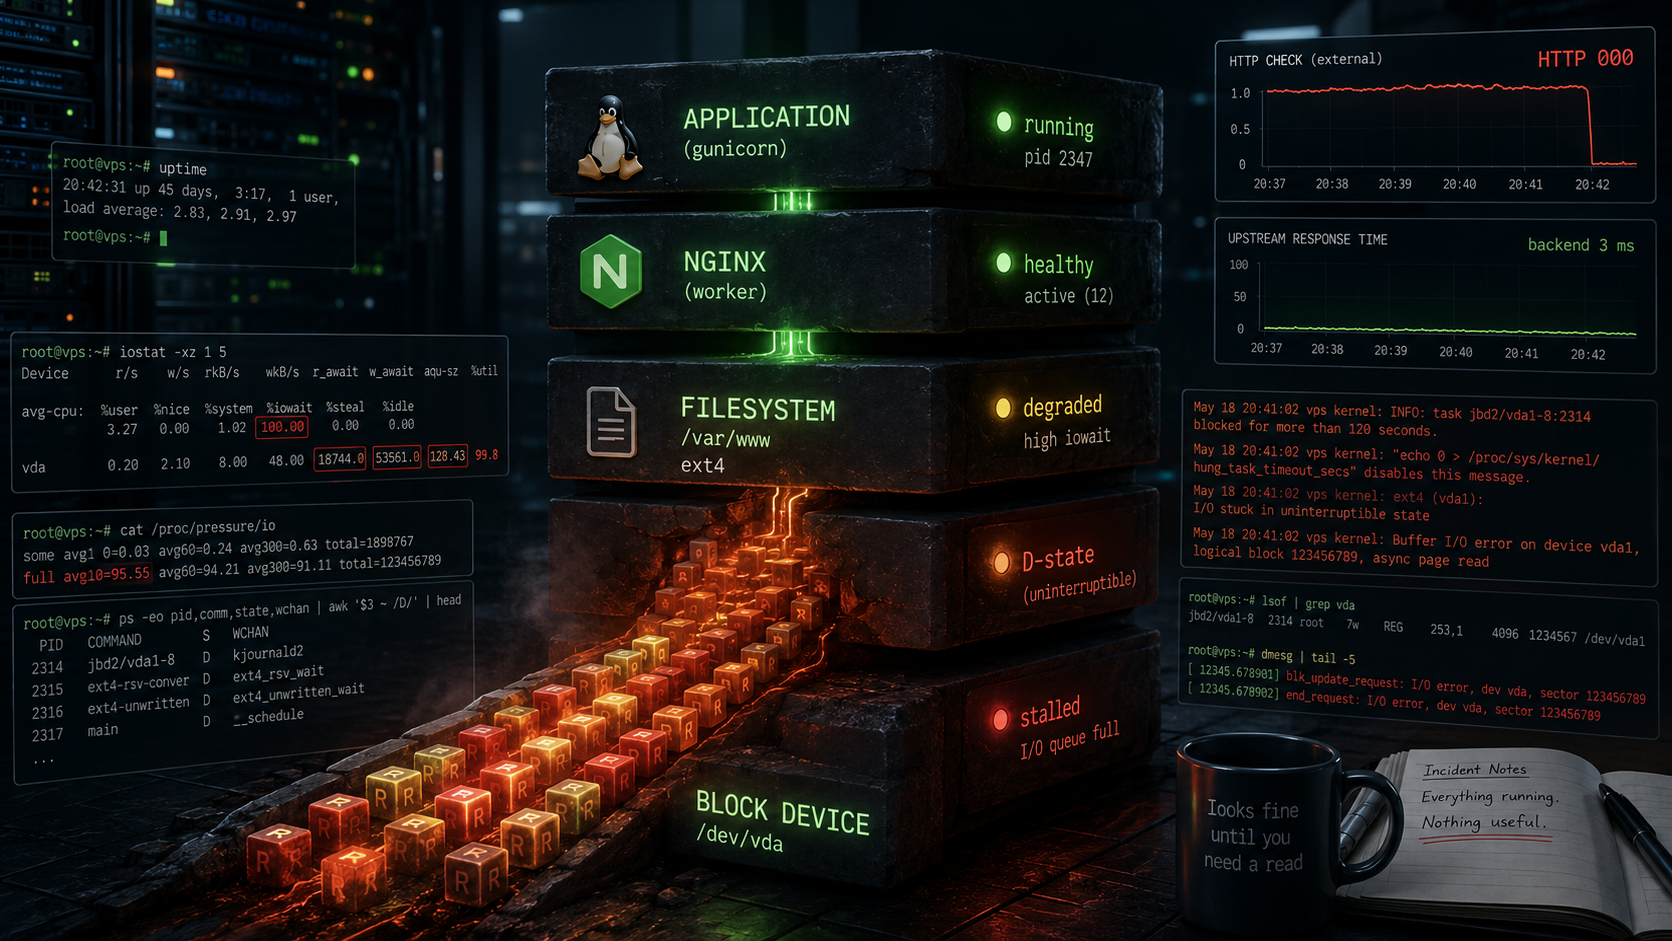
CPU iowait:       97-100%
I/O PSI full:     ~95-98%
read latency:     up to 18.7 seconds
flush latency:    up to 53.6 seconds
I/O queue depth:  128+
Those are seconds, not milliseconds.
At the worst point I observed ordinary reads taking up to 18.7 seconds and flushes taking more than 53 seconds.
The VPS was technically online.
The workload was barely moving.
This article is about how I traced that failure from the application layer down through Nginx, EXT4, Linux pressure metrics, D-state processes and the virtual block device.
It is also about where the investigation had to stop, because inside a VPS there is a point beyond which the guest simply cannot see.
And yes, eventually I cancelled the server.
FDCServers refunded me.
But this is not an article claiming that every FDCServers VPS behaves like this.
It is the story of one production VPS and one extremely interesting intermittent storage problem.
The first problem: the server looked healthy when it wasn't
Like most people, I started with the obvious checks:
top
free -h
df -h
systemctl status nginx
And this is where intermittent failures become dangerous.
During healthy periods, the machine genuinely looked healthy.
For example:
D-state processes: 0
CPU iowait:        ~0%
disk latency:      ~2-4 ms

I/O PSI some:      0.04
I/O PSI full:      0.04
Nothing there screams disaster.
If support had inspected the VPS at exactly that moment, they could honestly have told me:
Everything looks normal.
And they would have been right.
At that moment.
That became one of the most important lessons from the whole incident:
Never investigate an intermittent performance problem only after it has disappeared.
The useful evidence exists while the failure is happening.
Not after a reboot.
Not ten minutes later.
Not after load disappears.
During the failure.
The iostat output that made this impossible to ignore
Eventually I captured this:
r_await = 18744 ms
f_await = 53561 ms
aqu-sz  = 128.54
util    ≈ 100%
read    = 88 KB/s
That was the moment the investigation stopped being vague.
Roughly translated:
read latency    ≈ 18.7 seconds
flush latency   ≈ 53.6 seconds
queue depth     > 128
utilization     ≈ 100%
read throughput ≈ 88 KB/s
A device being 100% utilized does not automatically mean there is a problem.
A healthy storage device can be busy.
But the rest of the picture mattered:
enormous latency
queue depth above 128
almost no useful read throughput
blocked processes
failing HTTP requests
The virtual block device was extremely busy while accomplishing very little.
That is a very different situation from simply having a busy disk.
Why I didn't stop at iowait
During the worst periods I also saw:
blocked processes: 4-9
CPU iowait:        97-100%
CPU idle:          0%
It would be easy to look at that and say:
The CPU is spending 100% of its time waiting for the disk.
But I do not like using iowait as a complete diagnosis.
Linux CPU accounting is more nuanced than that.
iowait is useful evidence, but it is still evidence from one angle.
So instead of treating it as the answer, I started looking for independent signals.
The strongest one turned out to be PSI.
PSI showed that the workload itself was being stalled
Linux exposes Pressure Stall Information through /proc/pressure.
For I/O:
cat /proc/pressure/io
During one of the severe incidents:
some avg10=99.14
full avg10=95.55
Later, full approached 98%.
This was one of the clearest signals in the entire investigation.
In simplified terms:
somemeans at least some non-idle work is stalled on I/Ofullmeans all non-idle tasks are stalled at the same time
When full approaches 100%, the system may still technically be alive, but almost every opportunity for useful workload progress is being lost to I/O stalls.
That described my VPS almost perfectly.
The machine existed.
The processes existed.
But useful work was barely being completed.
D-state showed that this was bigger than one process
Next I looked for tasks stuck in uninterruptible sleep:
ps -eo state,pid,ppid,etime,wchan:50,comm,args \
  | awk 'NR==1 || $1 ~ /^D/'
During the failures I saw several unrelated components entering D-state:
jbd2
systemd-journald
Nginx workers
Nginx cache processes
other filesystem activity
One process entering D-state briefly is not enough to prove much.
But multiple unrelated processes blocking at the same time is different.
At that point, blaming one application worker no longer made much sense.
The affected processes shared something lower in the stack.
The filesystem and storage path became the obvious place to look next.
The kernel stacks showed exactly where Nginx was waiting
The blocked paths were revealing.
For jbd2 I saw paths involving:
wait_on_buffer
jbd2_log_wait_commit
jbd2_journal_commit_transaction
For Nginx:
folio_wait_bit_common
filemap_read
generic_file_read_iter
ext4_file_read_iter
vfs_read
pread64
Then the kernel produced this:
INFO: task nginx blocked for more than 122 seconds.
At the same time:
systemctl status nginx
still said:
active (running)
Both were true.
That distinction is worth remembering.
active (running) tells you the service has not exited.
It does not tell you the service is capable of completing useful work.
A process can exist.
A service manager can consider it healthy enough to remain active.
And users can still be staring at timeouts.
The most useful test took about three milliseconds
The cleanest experiment was not complicated.
I tested the normal public path through Nginx.
It failed:
HTTP=000
SSL connection timeout
Then I bypassed Nginx and called the backend directly on the same VPS.
The result:
connect = 0.000423 s
TTFB    = 0.003063 s
total   = 0.003139 s
About three milliseconds.
That was extremely useful.
The backend could:
accept the connection
execute the request
generate a response
return it almost immediately
At the same time, Nginx workers were blocked in filesystem reads.
So the failure boundary started looking like this:
application execution       -> progressing normally
filesystem-backed web path  -> not progressing normally
That did not reveal the physical root cause.
But it made the application itself a much less convincing suspect.
The application was doing its job.
Something lower in the filesystem and virtual storage path was not.
The VPS could go from healthy to unusable in about 30 seconds
The intermittent nature of the problem made it particularly annoying.
At one point I captured the VPS in this state:
HTTP:          200
D-state:       0
CPU iowait:    3%
r_await:       ~1.18 ms
I/O PSI full:  ~2.95%
Nothing alarming there.
Then roughly 30 seconds later:
D-state:       4
CPU iowait:    91%
CPU idle:      0%
I/O PSI some:  86.11%
I/O PSI full:  78.02%
r_await:       236.50 ms
HTTP:          000
And later:
CPU iowait:    96-100%
I/O PSI full:  ~98%
HTTPS queue:   512
HTTP:          000
Then the workload disappeared.
The machine recovered:
D-state:      0
CPU iowait:   6%
r_await:      ~0.98 ms
queue depth:  ~0.07
HTTP:         200
This explains why intermittent infrastructure failures can become so frustrating between a customer and a hosting provider.
I could show a VPS that was almost completely stalled.
Someone else could inspect the same VPS ten minutes later and see sub-millisecond storage latency.
Both observations could be completely accurate.
They were simply observing two different states.
Sometimes r_await = 0 tells you almost nothing
One strange moment in the investigation was seeing:
r_await = 0
while the VPS was obviously unhealthy.
At the same time there was:
extreme iowait
D-state processes
outstanding I/O
failing requests
almost no useful read throughput
So had the storage suddenly become perfect?
No.
The problem was that almost nothing was completing.
Metrics based on completed operations become less informative when the system reaches a state where operations barely complete at all.
That is why I stopped trusting any individual storage metric.
I wanted all of them together:
latency
IOPS
throughput
queue depth
in-flight I/O
D-state tasks
PSI
request completion
One metric can mislead you.
A group of independent metrics telling the same story is much harder to ignore.
The first major incident happened during a backup
This was where FDCServers entered the investigation more directly.
One of the first severe failures overlapped with a scheduled backup.
FDCServers confirmed that the backup was running.
That was a reasonable explanation candidate.
If the sequence had been:
backup begins
I/O stalls
backup ends
problem disappears forever
I probably would not be writing this article.
But the same class of storage stall later appeared outside that original backup window.
And it returned on multiple days.
So the backup could have explained one event.
It could not explain the full pattern I was observing.
One incident lasted more than four hours
During one incident, my own service logs later showed the VPS unavailable for:
4 hours, 41 minutes and 15 seconds
I need to be careful with that number.
I cannot prove that the storage stall caused that exact VPS state.
To prove that, I would need access to host-side information that I simply did not have.
And that gets to the main limitation of diagnosing infrastructure from inside a virtual machine.
My visibility looked roughly like this:
application
    ↓
Linux VFS
    ↓
EXT4
    ↓
virtual block device
    ↓
?
Everything behind that question mark belonged to infrastructure outside the guest.
Possibilities could include:
virtualization
host-level I/O queues
storage networking
distributed storage
physical media
host scheduling
other storage systems invisible to the VM
I could see what Linux inside the VPS was waiting for.
I could see where useful work stopped.
But I could not see the provider's entire storage architecture.
So I am not going to invent a root cause.
I cannot honestly say:
A physical SSD failed.
I cannot honestly say:
A specific storage node was broken.
I did not have that evidence.
FDCServers migrated my VPS to another node
Support continued investigating.
Eventually FDCServers migrated the VPS to another node.
That was a meaningful step.
If the problem had been isolated to something on the original host, moving the VM could have solved it.
At that point I hoped the investigation was finished.
Unfortunately, after the migration I captured another severe guest-side storage stall.
That does not prove that every FDCServers node had the same problem.
It does not prove that every event had an identical physical root cause.
And it certainly does not prove that the entire FDCServers infrastructure was unhealthy.
The conclusion I could support was much narrower:
From my perspective, the production problem affecting this VPS had not been eliminated.
That was enough for me.
At some point, debugging stops being fun and becomes an operational decision
I genuinely enjoyed this investigation.
That may sound strange considering it involved production problems, but this is exactly the kind of thing I like about Linux.
Linux turned:
My website randomly stops responding.
into something much more precise:
The application backend is healthy, while filesystem-dependent processes are simultaneously blocked below VFS/EXT4, the virtual block device is heavily queued, and almost the entire workload is stalled on I/O.
That is a useful technical result.
But a useful technical result does not automatically make production safe again.
I did not control:
the hypervisor
the physical host
the storage backend
the infrastructure behind the virtual disk
any of the provider-side systems below my VPS
And after the same class of failure returned even after migration, continuing the investigation stopped making operational sense.
Production is not supposed to be an endless forensic experiment.
So I asked FDCServers to cancel the VPS.
They refunded me.
I think that part matters too.
Is this a negative review of FDCServers?
For this particular VPS, yes.
The experience became bad enough that I no longer trusted the server with production traffic.
That is why I cancelled it.
But I do not think the evidence allows me to turn that into:
FDCServers is a bad hosting provider.
That is a much bigger claim.
My actual experience was mixed.
Things I appreciated:
the VPS worked normally before these incidents
support investigated the issue
they attempted to solve it with a node migration
they refunded me when I eventually left
Things I could not accept:
severe intermittent storage stalls
production requests timing out
reads reaching 18.7 seconds
flush latency reaching 53.6 seconds
the issue returning on multiple days
another severe stall after migration
So the strongest conclusion I am comfortable making is this:
One FDCServers VPS became unreliable enough for my production workload that I cancelled it.
That is what my evidence supports.
I have not retested their current infrastructure.
I cannot tell you how their VPS platform performs today.
Infrastructure changes constantly.
Hardware gets replaced.
Storage gets rebalanced.
Customers move.
Software gets updated.
Problems disappear.
Different problems appear.
A single past incident should not automatically become a permanent verdict about an entire provider.
What I actually proved
From inside the VPS, I had evidence for all of this:
read latency:       up to 18.7 s
flush latency:      up to 53.6 s
I/O PSI full:       almost 100%
CPU iowait:         almost 100%
I/O queue:          128+
Nginx:              blocked in filesystem reads
EXT4/jbd2:          blocked waiting for I/O
direct backend:     ~3 ms
HTTP through Nginx: timing out
I could demonstrate that:
the application backend could still respond quickly
filesystem-dependent processes were blocking
unrelated system components were being affected simultaneously
Linux showed extreme I/O pressure
the virtual block path showed severe queueing and latency
useful workload progress almost stopped
That was enough to locate the failure boundary.
It was enough to stop blaming the application.
And it was enough to make an operational decision.
What I could not prove
I could not prove:
which physical disk handled the I/O
whether any physical disk had failed
whether the underlying problem was host contention
whether distributed storage was involved
whether storage networking was involved
which exact provider-side component caused the stall
whether every incident shared exactly the same host-side root cause
I think this distinction matters.
When writing an incident report, I try to separate three things:
what I observed
what I suspect
what I cannot know from my layer
Those are not the same thing.
The Linux debugging workflow I use now
This incident changed how I investigate slow or mysteriously unresponsive Linux servers.
I still begin with the basics:
top
free -h
df -h
But if something feels wrong, I quickly collect more useful evidence:
date -u
uptime

cat /proc/pressure/io
cat /proc/pressure/memory
cat /proc/pressure/cpu

vmstat 1 10
iostat -x 1 10

ps -eo state,pid,ppid,etime,wchan:50,comm,args \
  | awk 'NR==1 || $1 ~ /^D/'

ss -lntp

journalctl -k --since "30 min ago" --no-pager
Then I try to isolate the request path:
public request
      ↓
reverse proxy
      ↓
direct backend
      ↓
filesystem
      ↓
block device
Instead of asking:
Why is the server slow?
I now prefer:
At which layer does useful work stop completing?
That question gives you somewhere concrete to investigate.
Capture evidence before you reboot
There is one final habit I took away from this incident.
Sometimes rebooting is absolutely the correct production response.
Availability matters.
But rebooting also destroys evidence.
Before rebooting you might have:
D-state:     high
I/O PSI:     ~97%
iowait:      ~100%
queues:      large
requests:    failing
After reboot:
D-state:     0
latency:     milliseconds
requests:    healthy
Great.
The service is back.
But the state you needed to investigate has disappeared.
If the business impact allows you a few minutes, capture:
UTC timestamp
PSI
vmstat
iostat
D-state + wchan
kernel messages
socket queues
request timings
Then recover the server.
A few minutes of evidence can be worth hours of investigation later.
The server was running. The workload wasn't.
That is the sentence that best summarizes the incident.
The VPS remained online.
Nginx remained running.
The backend process remained alive.
And during the worst periods Linux still showed:
read latency:       18.7 seconds
flush latency:      53.6 seconds
I/O PSI full:       ~98%
CPU iowait:         ~100%
queue depth:        128+
The application itself could respond in about three milliseconds.
But the filesystem-backed request path was barely progressing.
Eventually the story became:
FDCServers investigated
        ↓
VPS migrated
        ↓
severe storage stall appeared again
        ↓
I cancelled the VPS
        ↓
FDCServers refunded me
I never learned which exact host-side component caused the failure.
And I do not need to pretend that I did.
The guest-side evidence was enough to identify where progress stopped.
Enough to stop blaming my application.
Enough to communicate the problem.
Enough to decide that production should run somewhere else.
That is what good observability is supposed to give you.
A VM can be online.
A process can be running.
A service can show active (running).
Ping can work.
And the machine can still be accomplishing almost nothing.
Linux will usually give you the clues.
The difficult part is catching them while the failure is still happening.